This lab is practice for an important data structure that you’ll use in project 2: a doubly-linked list. Doubly-linked lists are tricky to implement correctly, so it’s good to get things right now and not on the project when you’ll be dealing with other stuff in addition to the linked list.
In this lab, you are using malloc and free, but on the project you will be implementing them. The rest of the linked list algorithms are the same regardless of how the nodes are allocated, though.
Programs made of multiple .c files
For this lab (and some of the assignments in the future), you won’t be writing the main function yourself. Instead, you are writing a small library of functions that the main function uses. (These days, this is a pretty typical role for C - writing library code that is called from other functions or other languages.)
To that end, you’ll be doing your work in one file, and main exists in another file. I’ve written a guide on how multi-file development in C works. Go read it.
Starting materials
You know the drill by now. wget these materials on thoth, unzip, and rename abc123_lab5.c with your username.
You will not submit lab5.h or lab5_tester.c. Do not do your work in them.
What I’ve given you:
abc123_lab5.c: where you will do your work. has some code in it for printing and testing the list, but otherwise empty.lab5.h: the header file for your_lab5.cfile. importantly it has the prototypes for the public functions, so that…- …
lab5_tester.ccan#includethat file and see those functions.- think of this like a built-in autograder. if your lab passes all these tests, you’ll be sure that you’ll get a 10/10 when the autograder is up.
compile.shis, well, see the next section.
0. Making compile.sh work (and compiling)
When you log into thoth, you are interacting with a shell program called bash. bash has its own very strange little programming language built into it. You can write programs for it in shell scripts, which is what compile.sh is.
We are not learning all the complexities of bash scripting in this course, so for now you can just imagine that a shell script is an easy way to run repetitive commands. Like compiling your program.
If you edit compile.sh, you will see this:
#! /bin/bash

gcc -Wall -Werror --std=c99 -g -o lab5 abc123_lab5.c lab5_tester.c
See, that’s the compilation command you’ll be using. But now you don’t have to copy-and-paste it every time.
To make compile.sh work, you need to do two things:
- edit
compile.shto replaceabc123with your username (cause you already renamed that file, right?) - on thoth, run this command:
chmod +x compile.shchmodchanges the mode of the file. thexmode means “executable.”- if you
ls -l, look in the leftmost column - you’ll seecompile.shhas somexs there. that means you can now run it like an executable file.
Now run it by doing ./compile.sh. This produces the lab5 file. If you run ./lab5, you’ll see there are 4 tests you can do (in the order you should tackle them):
./lab5 append./lab5 remove./lab5 split./lab5 all
Running any of those tests right now will show a failure message, a bunch of <empty>, or a segfault. Sooooo it’s not working!
What you’re making
You are making a doubly-linked list. This is a variant of linked list where each node in the list points to the next node and the previous node in the list. This way, you can move bidirectionally through the list. This is exactly the data structure that you’ll use on the allocator project.
A doubly-linked list has a head and a tail, and those pointers are declared as global variables (ewww) at the top of _lab5.c. The Node structure is declared in lab5.h.
In this list, each node has a weight associated with it. For this lab, the weight is just an exercise, but when you do the allocator project, this weight will instead by the data size of each block. You’re just practicing the algorithms for now!
There is also a total_weight global variable declared. This will track the total weight of all nodes in the list, to check that you are really distributing the weight correctly between the nodes when doing splitting and coalescing.
So to sum it up visually (the numbers in the nodes are their weights; the rightwards arrows → are the next pointers, and the leftwards arrows ← are the prev pointers):
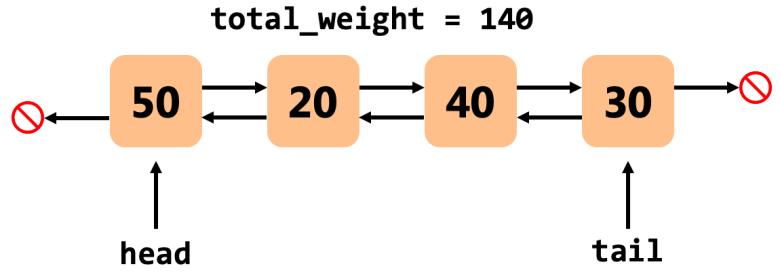
For this lab, every properly-formed doubly-linked list has these properties:
- Each node points to the node after it and before it
- The head node’s
previsNULLand the tail node’snextisNULL(that’s the 🚫 signs) - The sum of the node weights in the list is equal to
total_weight - Either both
headandtailareNULL, or neither of them are. (It’s impossible for just one to beNULL.)
Think and draw out to yourself what an empty list would look like, and a list with just 1 node. Convince yourself that all of the above properties hold for those edge cases!
1. Appending to the list
In _lab5.c there are two groups of functions that you will implement:
- the low-level functions which are currently all commented out
- the high-level functions which call the low-level functions and which are public to other files
The first ones you need to implement are involved in creating nodes and linking them into the list. If you look in lab5_tester.c, the test_append test calls node_append 3 times and checks its return values.
node_append currently contains this code:
	(void)weight;

	CHECK();
	return NULL;
The (void)variable_name; syntax is a weird thing that tricks the compiler into thinking you are using that variable. If you remove that line, the program will not compile, because it complains about weight being unused.
The CHECK() line calls the check_list_integrity() and print_list() functions for you. It’s SCREAMING because it’s a macro, not a function. It’s defined in lab5.h.
We’ll come back to preprocessor macros and conditional compilation. Don’t worry about it for now.
Finally it returns NULL to, again, make the compiler happy.
So let’s write some code. From lowest- to highest-level, here’s what you have to implement for the first test:
node_link- (this function is commented out; uncomment it)
- read the comment above
node_link. that’s what it should do. (theA == NULLcase is real easy.) - the best way to figure out linked list crap is to draw it. use paper, a whiteboard, a tablet, a zen garden and a stick, whatever works for you. look at the example diagram above, and think about what you would have to do to insert a node after each of the nodes in that diagram.
Bis the new node that you want to insert;Ais the node that you want to insert it after.- the arguments are ordered A, B because at the end of it, you want
A <-> B.
- the arguments are ordered A, B because at the end of it, you want
- don’t forget that sometimes pointers are
NULLand that you have to check that before you dereference them (that is, use the->operator on them). - this function does not have to handle linking a node to the beginning of the list, but it does have to handle linking a node to the end of the (non-empty) list.. hint hint!
node_change_weight- update
total_weightby subtracting the node’s current weight from it and adding the new weight to it; - then set the node’s weight to
weight.
note that this is the only function that will change
total_weight! this is on purpose! global variables suck but one way to make them suck less is to change them in as few places as possible..- update
node_alloc- allocate a
Nodestruct on the heap (see below); - set its
nextandprevtoNULLandweightto 0 (see below); - use
node_change_weightto change its weight toweight; - return it.
- allocate a
node_append- remove the
(void)var;line(s) from each high-level function as you implement it. - call
node_allocto create a node with the given weight; - call
node_linkto link that node after thetail; - do
CHECK()(so leave that line in); - and return that node instead of
NULL.
- remove the
Allocating a Node struct on the heap
You can use either malloc or calloc to allocate a Node on the heap. calloc will set all the fields to 0/NULL for you; malloc will force you to set those fields yourself.
Whichever you use, be careful about the size that you pass to them. You want to allocate a Node struct, not a pointer to a Node. Yes, malloc/calloc return a pointer to the allocated memory, but don’t get it confused! The pointer points to the Node struct which lives on the heap, and that struct has to be the correct number of bytes.
Running the first test: ./lab5 append
The first test, when successfully run, outputs this:
 <empty>
 [100]
 [100] [200]
 [100] [200] [300]
It prints <empty> at the beginning to show that the list is empty, and after appending each node, it prints the list.
If it prints this and then crashes, that’s still no good. If you get any crashes any time, that’s never good. Don’t forget to use gdb to diagnose the crash location!
2. Removing the tail of the list
Removing nodes from doubly-linked lists is such a tedious task. Two functions for this one.
node_unlink_and_free- remove
nfrom the list;- this is tricky! you have to consider what happens when you remove a node from the ends of the list. (and while you’re considering that, consider what happens when the list is only 1 node long and you remove that!)
- change
n’s weight to 0 withnode_change_weight;- this updates
total_weight
- this updates
free(n).
- remove
node_remove_tail- call
node_unlink_and_freeon thetailnode; CHECK().
- call
./lab5 remove prints this on success:
<empty>
[100]
[100] [200]
[100] [200] [300]
[100] [200]
[100]
<empty>
It gets longer and shorter. Whee!
3. Splitting nodes
Just one function to implement here, and it’s an easy one because you’ve already made all the low-level functions! …well, they might not be correct, and this test will reveal that.
node_splitnode_alloca new node with a weight ofwanted;node_linkit aftern(careful with the order of the arguments here);node_change_weightn’s weight to subtractwantedfrom its current weight;CHECK();- return the new node.
./lab5 split prints this:
 <empty>
 [100]
 [100] [100]
 [ 80] [ 20] [100]
 [ 80] [ 20] [ 65] [ 35]
 [ 80] [ 20] [ 65]
 [ 80] [ 20]
 [ 80]
 <empty>
You can see after the [100] [100] line, the first node gets split into [ 80] [ 20]. Then the last node gets split too. Then they’re removed!
This test may fail not because of node_split but because of node_link. This is the first time the “linking a node into the middle of a list” case is tested in node_link. So if you get errors like “next’s prev doesn’t point back to it” or “total_weight == 200 but weight calculated from list nodes is 100” or something, take a look at your node_link function’s “middle of list” case. It’s definitely the most involved and trickiest to get right. D R A W. I’m not kidding.
4. Coalescing nodes
First is node_coalesce_with_next. The comment on that is pretty self-explanatory.
Then is node_coalesce_with_neighbors. In the past, many people tried to redo the work here that they already did in node_coalesce_with_next. Remember like I said in the lecture on memory deallocation: coalescing 3 things isn’t a special case. You coalesce the first two, and then coalesce that with the third one. So, node_coalesce_with_neighbors calls node_coalesce_with_next 0, 1, or 2 times.
It’s a little tricky. There are four cases to handle:
NULL <- n -> NULL: do nothing and returnn.NULL <- n -> next: coalescenwith its next; then returnn.prev <- n -> NULL: coalesceprevwith its next ⚠️see below; then returnprev⚠️see below.prev <- n -> next: coalesceprevwith its next; do it a second time; returnprev.
The last two cases are trickier because when you coalesce prev with its next, well, its next is n. That means that after calling node_coalesce_with_next on n->prev, you can no longer reliably access the data that n points to anymore! So just.. yanno, put n->prev into a variable named prev and use that. :B
Be sure to call CHECK() at the end of both of these functions before returning. I have it written in there already but like, don’t take it out or anything.
./lab5 all prints:
 <empty>
 [100]
 [100] [100]
 [ 80] [ 20] [100]
 [ 80] [ 20] [ 65] [ 35]
 [ 80] [ 85] [ 35]
 [ 80] [ 85] [ 35] [ 50]
 [ 80] [ 85] [ 35] [ 50] [ 70]
 [ 80] [120] [ 50] [ 70]
 [ 80] [170] [ 70]
 [ 80] [170] [ 70]
 [ 80] [240]
 [ 80] [240]
 [320]
 [320]
 [320]
 <empty>
Woo!
node_unlink_and_free might fail here, because this is the first time its “remove from the middle of the list” case is exercised. If you get crashes, you might find out that it’s the culprit, not the coalescing.
If you end up with [320] at the end, but lines are missing in the output: there are two possibilities:
- One, the
CHECK()is what’s printing those messages out. If you implementednode_coalesce_with_neighborssuch that you return before callingCHECK(), it won’t print out all the lines.- The way to fix this is to put a call to
CHECK()before every return in that function.
- The way to fix this is to put a call to
- If that’s not it, it’s probably because you didn’t implement
node_coalesce_with_neighborsby usingnode_coalesce_with_nextlike I told you to.
If you end up with [320] at the end, and have the right number of lines in the output, but some of the lines differ from what I have: that actually might not be a problem. In the A <-> B <-> C case where you coalesce B with its neighbors, there are two orders you can do it:
- coalesce
AandBtogether:AB <-> C - coalesce
ABandCtogether:ABC
or
- coalesce
BandCtogether:A <-> BC - coalesce
AandBCtogether:ABC
My program does the first way, and yours might be doing the second. Either way gets you the same final result, but the intermediate block sizes will be different. The autograder will accept either way.
Submission
Only submit your _lab5.c file. Do not submit lab5.h or lab5_tester.c.
Like before, download _lab5.c and then upload it to Gradescope when the autograder is up.